The **S&P BSE Sensex** closed at **83,450.96** on February 17, 2026, posting a steady gain of **+173.81 points (+0.21%)** in a session ranging from a low of 82,987.43 to a high of 83,598.00. Volume reached approximately 11.96 million shares (or equivalent index level), reflecting continued investor interest as the benchmark index consolidates near multi-month highs.
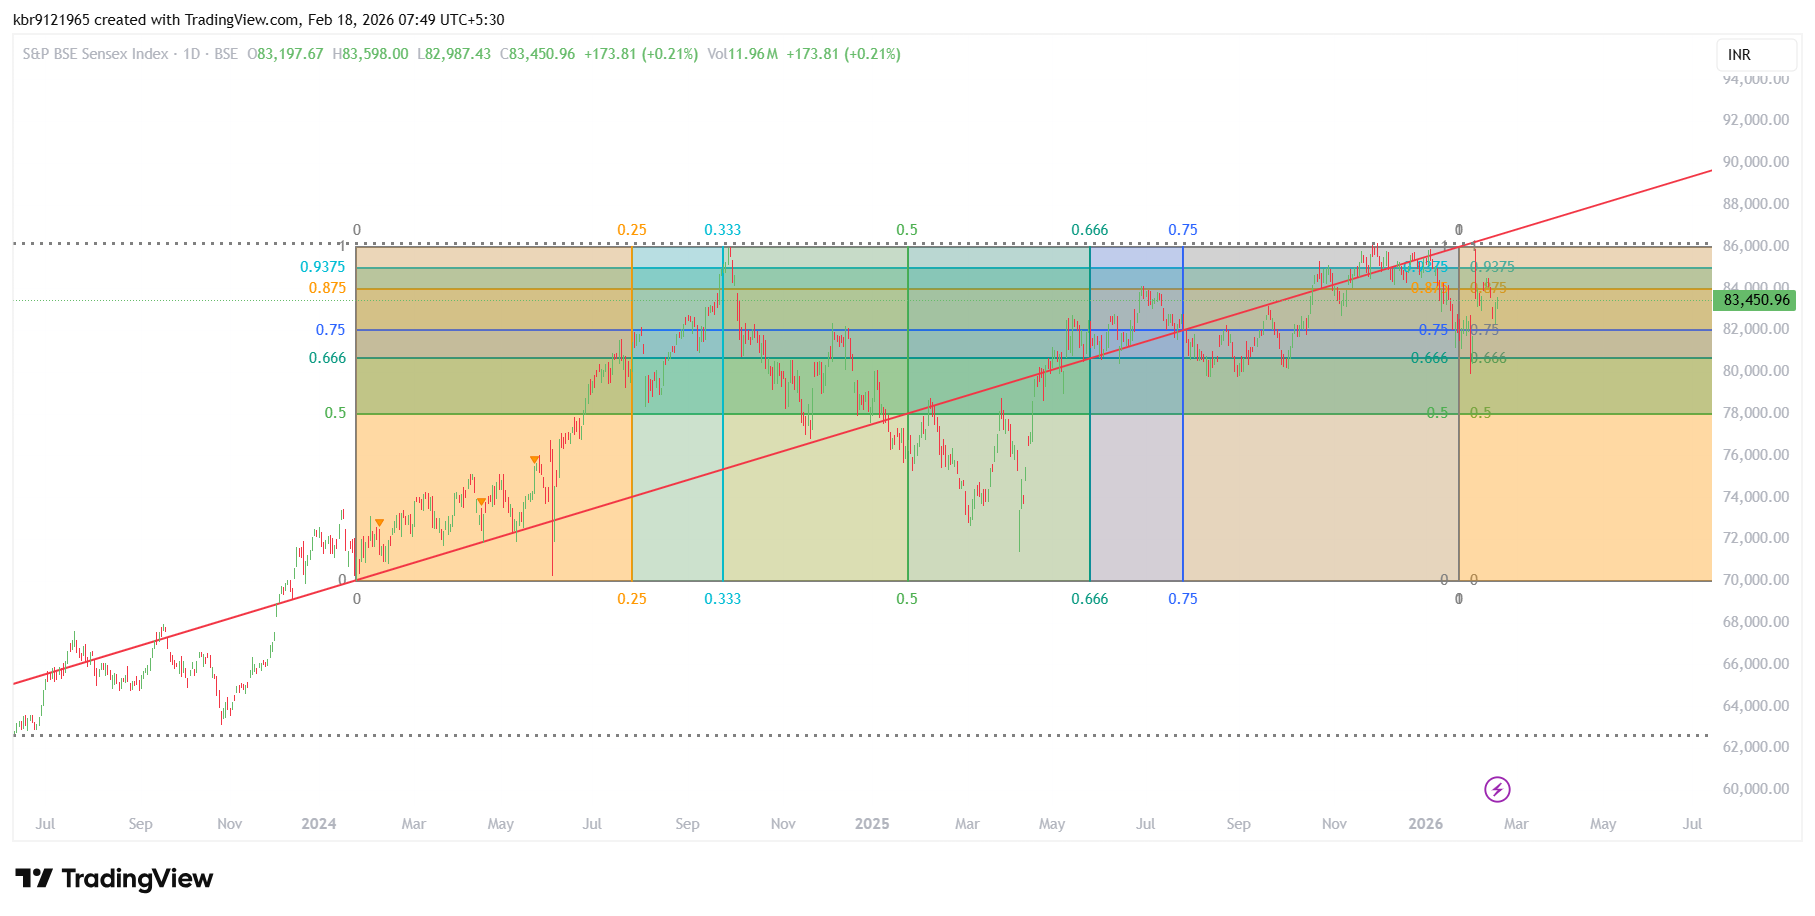
The Squaring Chart depicts horizontal Fibonacci extension/retracement levels with a diagonal trendline and vertical time-zone grids. The setup tracks the index’s journey from mid-2024 lows through 2026 and beyond, illustrating how price action has aligned with mathematical ratios in both dimensions.
### Breaking Down the Chart’s Core Features
– **Diagonal Red Trendline**: This projects the primary uptrend from a significant 2024 base (around the 60,000–70,000 zone marked as 0%). The line slopes upward, intersecting future time zones and suggesting sustained bullish momentum if respected. Recent price action hugs this channel’s upper boundary.
– **Horizontal Fibonacci Extensions/Retracements**: Measured from a major low to a peak (likely the all-time high near 86,159 in late 2025/early 2026):
– Upper bands include **0.9375** (near 92,000+ potential), **0.9275**, **0.875** (around 88,000–90,000 zone).
– The current level at **83,450** resides comfortably above the **0.75** extension (~82,000 area) and tests higher toward **0.8–0.875** zones.
– Key supports below: **0.666** (~80,000–81,000), **0.5** (~78,000), and deeper ones toward **0.333–0.25** (lower 70,000s).
The index has powered through the 2025 consolidation phase (roughly 76,000–82,000) and now trades in extended territory, well above the 50% midpoint and in the upper Fibonacci bands.
– **Fibonacci Time Zones**: Vertical lines and markers (0.25, 0.333, 0.5, 0.666, 0.75, etc.) highlight projected turning windows or acceleration points derived from the Fibonacci sequence. The chart spans 2024–2027+, with clusters indicating higher-probability volatility or reversal periods in 2026.
Historically, candles have reacted at several intersections, reinforcing the tool’s relevance.
### Market Context & Current Positioning
After peaking near **86,159** in December 2025, Sensex underwent a healthy correction into early 2026 before rebounding. Recent sessions show resilience, with February 17 delivering a positive close near session highs amid buying in IT, PSU banks, and select large-caps.
At **83,450**, the index is:
– Pressing against resistance in the **83,500–84,000** area (near recent highs and approaching 0.8–0.875 extensions).
– Holding firm above strong support at **82,500–83,000** (aligned with 0.75 and recent swing levels).
– Maintaining a clear long-term uptrend since 2024, with the diagonal projection supporting further upside if domestic flows and global sentiment remain favorable.
The broader market shows mixed sectoral rotation, with banking and IT providing leadership while metals and select cyclicals lag.
### Outlook: Bullish Structure Intact
**Bullish Scenario** — Sustained closes above **83,600–84,000** could propel the index toward **85,000+** and extensions near **86,000–88,000** (0.875–0.9275 zones) in the medium term, especially if time-zone clusters align positively in mid-2026.
**Neutral/Range Scenario** — Sideways action between **82,500–84,000** as the market digests prior gains near lifetime-high territory. This remains likely without a strong catalyst.
**Bearish Scenario** (currently low probability) — A decisive break below **82,500–83,000** might trigger a pullback to **80,000–81,000** (0.666 zone) or deeper. Only sustained weakness below these levels would challenge the primary trend.
For positional investors, pullbacks toward **82,800–83,200** could offer solid entry points with stops below recent lows. Momentum traders should monitor for a breakout above **84,000** to confirm the next impulsive move.
### Wrapping Up
The Sensex continues demonstrating structural strength in 2026, trading in extended Fibonacci territory with controlled corrections and clear time-price harmony on display. This chart underscores a bullish long-term bias, with realistic targets in the mid-to-upper 80,000s–90,000s if the uptrend channel holds.
Indian equities remain near record levels, supported by resilient domestic flows despite periodic global noise. Tools like this Fibonacci projection remind us that markets often follow predictable mathematical patterns — in price, time, and momentum.
What’s your take on Sensex’s path ahead? Positioning for more upside, or anticipating a deeper retracement first? Share below! 📈🇮🇳
*Disclaimer: This is educational analysis based on the provided TradingView chart and public market data as of February 18, 2026. Not investment advice — conduct your own due diligence and manage risk accordingly.*