Bitcoin’s price action in early 2026 has been a stark reminder of cryptocurrency’s cyclical nature. in accordance with Law of Vibration Gann After reaching an all-time high above $126,000 in late 2025 (likely October), BTC has undergone a significant correction, shedding over 45-50% from that peak. As of February 18, 2026, Bitcoin trades around $67,000–$68,000 on major exchanges like Bitsamp, with the daily chart showing a close near $67,327 (down ~0.21%) amid low volume of about 15,900 BTC.
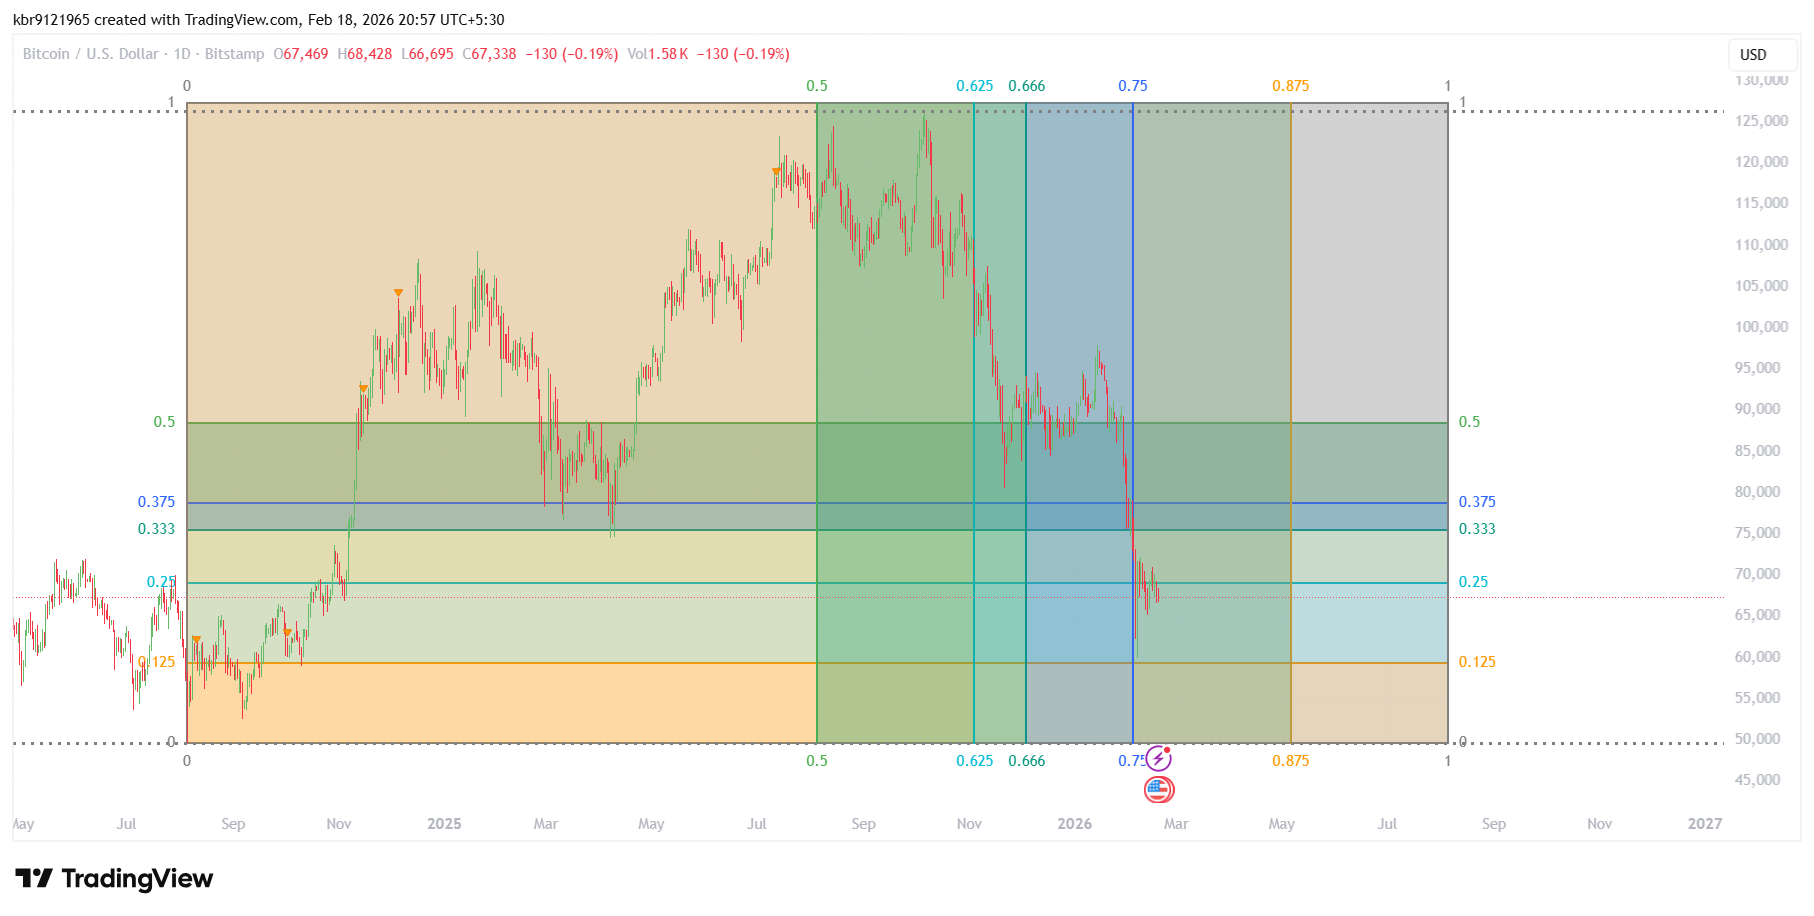
The provided Trading View chart (daily timeframe, logarithmic scale) overlays a customized Fibonacci retracement tool used for Gann trading Strategy applied across a major cycle leg—likely from a 2025 low to the 2025 peak. Key horizontal levels mark Fibonacci ratios:
- 0.0 → bottom of the measured move (around $50,000 or lower in prior consolidation).
- 0.125, 0.25, 0.333, 0.375 → lower support zones where price found temporary bids during the decline.
- 0.5 → major halfway retracement (~$90,000 area), which acted as resistance on the way up and now as a psychological pivot.
- 0.625, 0.666 → deeper correction zones.
- 0.75 → current critical zone where price has been reacting sharply (around $67,000–$70,000).
- 0.875 and 1.0 → upper targets if a recovery materializes, pointing toward $110,000+.
The chart uses color-coded zones (beige/orange at bottom for accumulation, green for uptrend, blue for distribution/correction, gray for deeper bear phases). Bitcoin has fallen into the 0.75 retracement band (blue zone), with a notable wick lower testing closer to 0.666–0.75 confluence. The price is hovering just above the 0.75 line, with recent candles showing rejection but no strong reversal yet.
What This Technical Setup Tells Us
This deep retracement aligns with post-peak corrections seen in previous Bitcoin cycles (e.g., 2017–2018 or 2021–2022), where 70–85% drawdowns from ATH were common before the next leg higher. The current drop to ~0.75 Fib level places BTC in a “deep but not catastrophic” correction territory—still above the more bearish 0.875 zone that would signal a potential multi-year bear market. How to calculate this for the Trend Analysis is what we learn in our Gann Price Cycles Course and Gann Time cycle Course.
Short-term: We learn to do short term analysis in our Gann Intraday Trading Course.
- Support clusters around $65,000–$66,000 (near the daily low and lower blue zone boundary).
- Resistance overhead at $70,000 (recent failed reclaim) and then the $75,000–$80,000 area (closer to 0.666 Fib).
- Momentum remains soft: declining volume, failed bounces above $70k, and macro uncertainty (e.g., outflows from U.S. spot Bitcoin ETFs totaling billions since late 2025) weigh on sentiment.
Many analysts view the $60,000 level as the next major downside target if support breaks—aligning with bearish forecasts eyeing a test of year-to-date lows.
Broader Context in Early 2026
Bitcoin’s slide coincides with retreating institutional interest (notably U.S.-based flows) after the 2025 bull run euphoria. Wall Street’s embrace via ETFs was expected to dampen volatility, but instead, BTC has underperformed gold and equities in recent months. Open interest in futures has dropped, signaling reduced leverage and conviction.
Yet history suggests these periods of consolidation often precede renewed strength—especially if macro conditions improve (e.g., easing monetary policy, renewed adoption narratives). The chart’s structure doesn’t scream “cycle over”; instead, it shows a healthy (if painful) reset after an explosive 2025.
Final Thoughts for Traders and Holders
If you’re watching this chart:
- A hold above the 0.75 Fib (~$67k zone) keeps the door open for a relief rally toward 0.666 or higher.
- A decisive break below could accelerate selling toward $60k or lower, testing conviction among long-term holders.
- For contrarians, the current zone offers a potential high-risk entry if reversal signals emerge (e.g., higher lows, volume spike).
Bitcoin remains in correction mode, but the Fibonacci framework highlights that the story isn’t finished. Patience has rewarded BTC holders through every major drawdown in its history—whether this February 2026 dip becomes another buying opportunity or extends further will depend on catalysts yet to appear.
What are your thoughts on this retracement level? Are you accumulating, waiting for confirmation, or hedging? Share in the comments! 🚀