
Gann Angles remain one of the most respected yet underutilized tools in technical analysis. Created by legendary trader W.D. Gann nearly a century ago, these geometric lines blend price, time, and angles to identify dynamic support, resistance, and trend reversals with remarkable accuracy.
If you trade the Nifty 50 Index, understanding Gann Angles can give you a clear edge—especially in volatile phases like the one we’re seeing right now. In this SEO-optimized guide, we break down exactly what Gann Angles are, how to draw them, and how they are playing out on the latest Nifty 50 daily chart (as of March 31, 2026).
What Are Gann Angles and Why Do They Matter in Nifty Trading?
Gann Angles are trend lines drawn at specific angles on a price chart. Unlike regular trend lines, they are based on the relationship between price movement and time. Gann believed that markets move in predictable geometric patterns and that “time is more important than price.”
The most important Gann Angle is the 1×1 angle (45 degrees).
- When price trades above the 1×1 angle → Bullish momentum.
- When price trades below the 1×1 angle → Bearish momentum.
Other key Gann Angles include:
- 2×1 (63.75°) – Steep bullish angle
- 1×2 (26.25°) – Shallow bearish angle
- 4×1, 8×1, 1×4, 1×8 – Used for stronger or weaker trends
Traders draw Gann Fans (a set of multiple angles) from major swing highs or lows. These lines then act as dynamic support and resistance that move with time.
Pro Tip for Nifty traders: Because Indian markets follow a 1:1 price-time ratio on daily charts (when scaled correctly), Gann Angles work exceptionally well on Nifty 50 and Bank Nifty.
How to Draw Gann Angles on TradingView (Step-by-Step)
- Open the Nifty 50 chart on TradingView.
- Select the Gann Fan tool (under “Gann and Fibonacci” tools).
- Click on a major swing low (for upward fan) or swing high (for downward fan).
- The software automatically draws the 1×1, 2×1, 1×2, etc., angles.
- Adjust the scale so the 1×1 line is exactly 45 degrees (this is critical for accuracy).
Once drawn, watch how price reacts when it touches these lines.
Live Nifty 50 Chart Analysis Using Gann Angles (March 31, 2026)
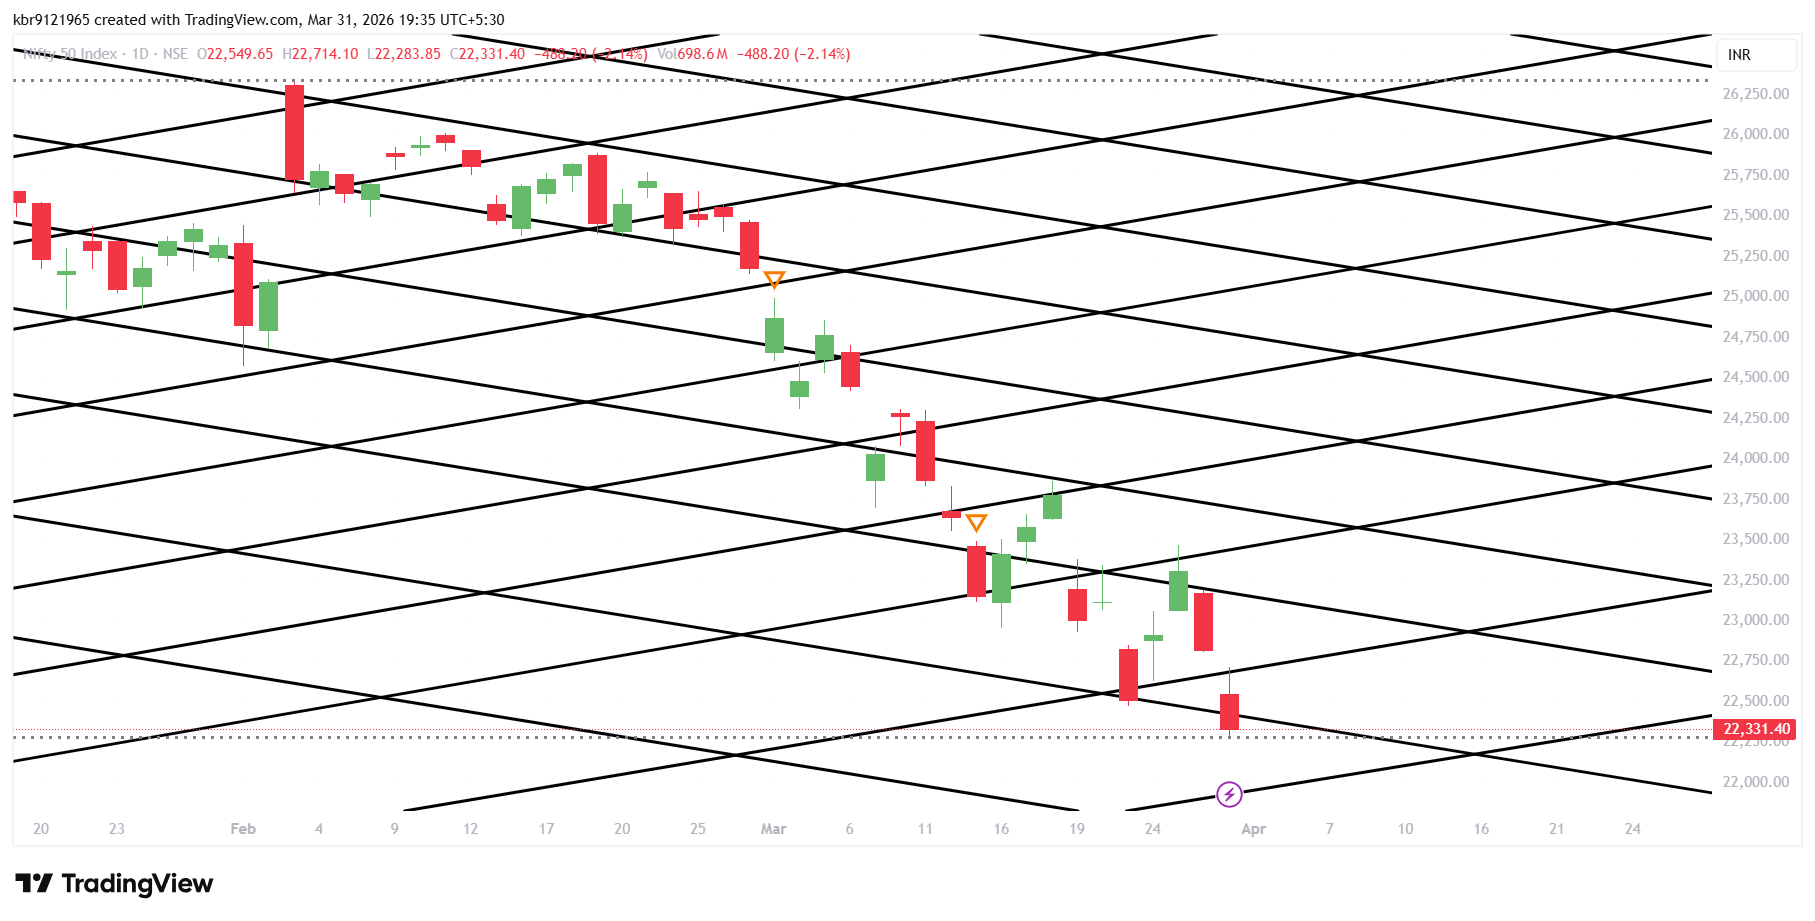
Look at the Nifty 50 daily chart below (sourced live from TradingView):
Key observations using Gann Angles:
- Major downtrend confirmation: After hitting highs near 26,250 in early February, Nifty broke below the 1×1 Gann Angle drawn from the February peak. This breakdown turned the entire structure bearish.
- Orange triangle markers: These highlight precise Gann Angle interactions. Notice the upward-pointing orange triangle in mid-March near 24,800 — price bounced exactly off the 1×2 angle, offering a short-term relief rally.
- Recent rejection at resistance: In late March, Nifty rallied but failed at the descending 1×1 Gann Angle (marked by the downward orange triangle). The sharp red candle that followed confirms strong resistance.
- Current support zone: As of March 31, 2026, Nifty is hovering near 22,331. The purple lightning-bolt marker at the bottom suggests a potential Gann time-cycle confluence around April 7 — a date many Gann traders are watching closely for a possible reversal or acceleration.
- Volume & momentum: The 2.14% drop on March 31 came with above-average volume (698.6M shares), showing sellers are still in control below the key Gann Angles.
Bottom line from the chart: Until Nifty reclaims the 1×1 Gann Angle (currently near 23,500–23,750 zone), the broader trend remains bearish. A decisive close above this angle would signal a potential trend reversal.
How Professional Traders Use Gann Angles for Nifty Buy/Sell Signals
- Buy signal: Price bounces from a rising 1×1 or 2×1 Gann Angle + bullish candlestick confirmation.
- Sell signal: Price rejects a falling 1×1 or 1×2 Gann Angle + bearish divergence on RSI.
- Trend strength: If price stays above multiple upward Gann Angles → strong uptrend (target next higher angle).
- Time factor: Gann Angles also predict time-based reversals. Watch for price to reach an angle exactly on a Gann “natural” date (e.g., 30, 45, 60, or 90 days from a high/low).
Many Nifty option traders combine Gann Angles with Gann Squares and time cycles for high-probability expiry-day setups.
Advantages & Limitations of Gann Angles in Nifty Trading
Advantages:
- Works on any timeframe (especially daily and weekly Nifty charts).
- Combines price + time — something moving averages alone cannot do.
- Excellent for spotting major trend changes early.
Limitations:
- Requires correct chart scaling (wrong scale = useless angles).
- Not 100% accurate in sideways/choppy markets.
- Best used with other confirmations (volume, RSI, candlestick patterns).
Final Thoughts: Should You Add Gann Angles to Your Nifty Trading Strategy?
Absolutely — Gann Angles are not just historical theory; they are actively working on the Nifty 50 market right now (as clearly visible in the chart above). Whether you are a swing trader, intraday trader, or long-term investor, learning to read these angles can dramatically improve your timing and risk-reward ratio.
Next step: Open your TradingView chart, apply the Gann Fan tool from the February 2026 high, and start tracking how Nifty reacts to the 1×1 and 1×2 angles in the coming weeks.
Keyword focus: Gann Angles, Gann Angles Nifty, Gann Fan Nifty 50, W.D. Gann trading strategy.
Save this post and bookmark the chart — the next major Nifty move is likely to happen exactly where the Gann Angles intersect.
Happy trading! Last updated: March 31, 2026
Disclaimer: This is for educational purposes only. Always do your own research and consult a SEBI-registered advisor before trading.