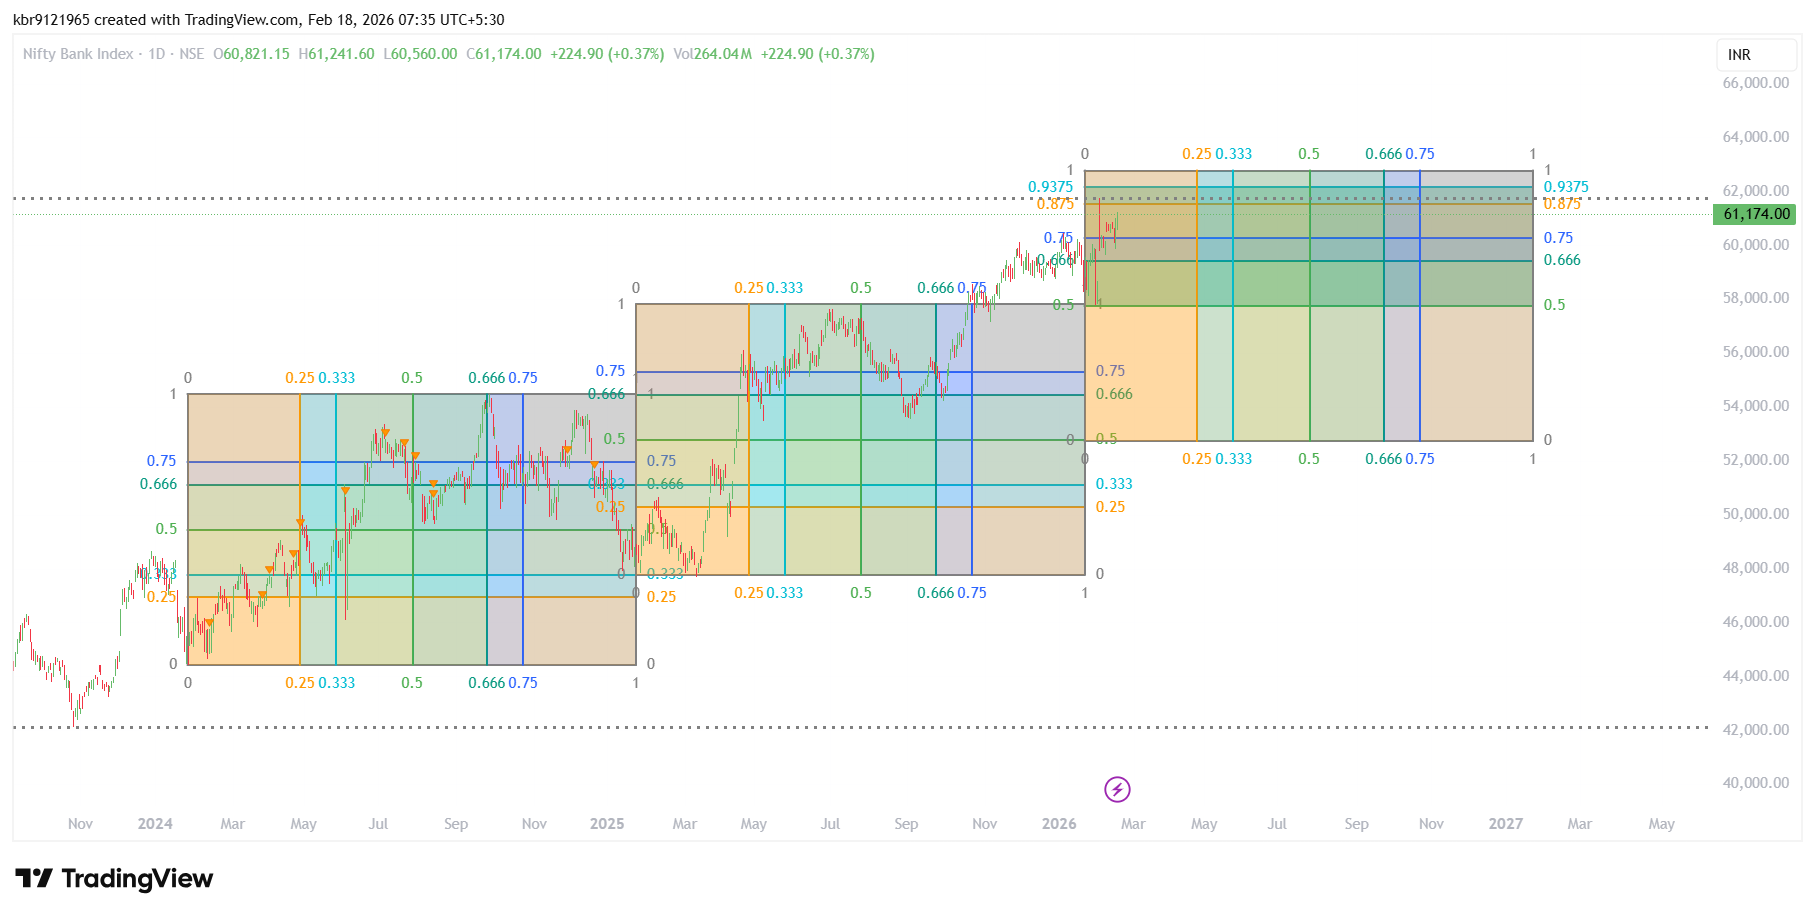
Nifty Bank closed at 61,174.00 on February 17, 2026, posting a solid gain of +224.90 points (+0.37%) in a session that saw the index trade between a low of approximately 60,560 and a high of 61,241.60. Volume clocked in at around 264 million shares, indicating healthy participation as banking stocks led the broader market recovery.
The Squaring Chart for Bank Nifty is combining horizontal Fibonacci retracement/extension levels with diagonal time-based projections and vertical time-zone grids. The overlay spans from late 2024 through 2027–2028, highlighting how the index has respected mathematical harmony in both price and time.
Key Elements of the Chart
- Diagonal Projections & Time Zones: The chart features multiple diagonal lines and vertical divisions representing Fibonacci time zones. These project potential turning points or acceleration phases based on the sequence derived from a significant low (likely in 2024 around the 42,000–48,000 area labelled as 0%).
- Horizontal Fibonacci Levels: Drawn from a major low to a presumed high (possibly the recent peak near 61,764.85 in early February 2026):
- Upper extensions include 0.9375 (~62,000+ zone) and 0.875 (around 61,800–62,000 area).
- The current close at 61,174 sits just below the 0.875 level (dotted line near 61,800+), acting as immediate resistance.
- Key support zones below include 0.75 (around 60,000–60,500), 0.666 (~59,500–60,000), 0.5 (mid-58,000s), and deeper retracements down to 0.25–0.333 (lower 50,000s).
The index has climbed impressively from the 2025 consolidation range (roughly 52,000–58,000) into new high territory, now testing the upper Fibonacci bands after a sharp rally in late 2025–early 2026.
Current Market Position & Interpretation
After touching an all-time high of 61,764.85 earlier in February 2026, Bank Nifty saw a brief pullback before rebounding strongly. The February 17 session formed a bullish candle, closing near the session high and pushing above key short-term hurdles around 61,000.
At 61,174, the index is:
- Pressing against resistance near 61,200–61,600 (near the 0.875 extension and recent high zone).
- Holding firmly above strong support at 60,600–61,000 (aligned with recent swing lows and the 0.75–0.8 area).
- Maintaining a robust uptrend since the 2025 base, with the time-price projections suggesting continued bullish structure into mid-2026 if momentum persists.
The banking sector has outperformed the broader Nifty in recent weeks, driven by positive sentiment around credit growth, improving asset quality, and expectations around rate cycles. Relative strength versus Nifty 50 remains evident.
Short-Term & Medium-Term Outlook
Bullish Case — A decisive close above 61,600–61,800 (breaking the 0.875 level) could open the door to fresh extensions toward 62,000+ and potentially 64,000 in the coming quarters, aligning with higher Fibonacci time-price targets and ongoing sector tailwinds.
Neutral/Consolidation Case — Choppy range trading between 60,600–61,600 is possible as the index digests recent gains near lifetime highs. Watch for volume confirmation on any breakout or pullback.
Bearish Case (lower probability at present) — A failure to hold 60,600 could trigger a deeper correction toward 59,500–60,000 (0.666–0.75 zone) or even 58,700 support. Only a close below these levels would question the primary uptrend.
Positional traders might look for dips toward 60,800–61,000 as buying opportunities with stops below recent lows. Momentum players can target a breakout above 61,600 for the next leg higher.
Final Thoughts
Bank Nifty continues to showcase strength in 2026, trading near all-time highs with controlled volatility and clear Fibonacci-guided structure. The combination of price extensions and time-zone clusters on this chart suggests the rally from 2025 lows remains very much intact, with potential for further upside if global and domestic cues stay supportive.
Are you bullish on banking stocks heading into the next quarter? Planning to add on dips or waiting for a confirmed breakout? Drop your views in the comments! 📈🏦
Disclaimer: This is educational commentary based on the shared TradingView snapshot and publicly available market data as of February 18, 2026. Markets are dynamic — always conduct your own analysis and manage risk responsibly. Not investment advice.