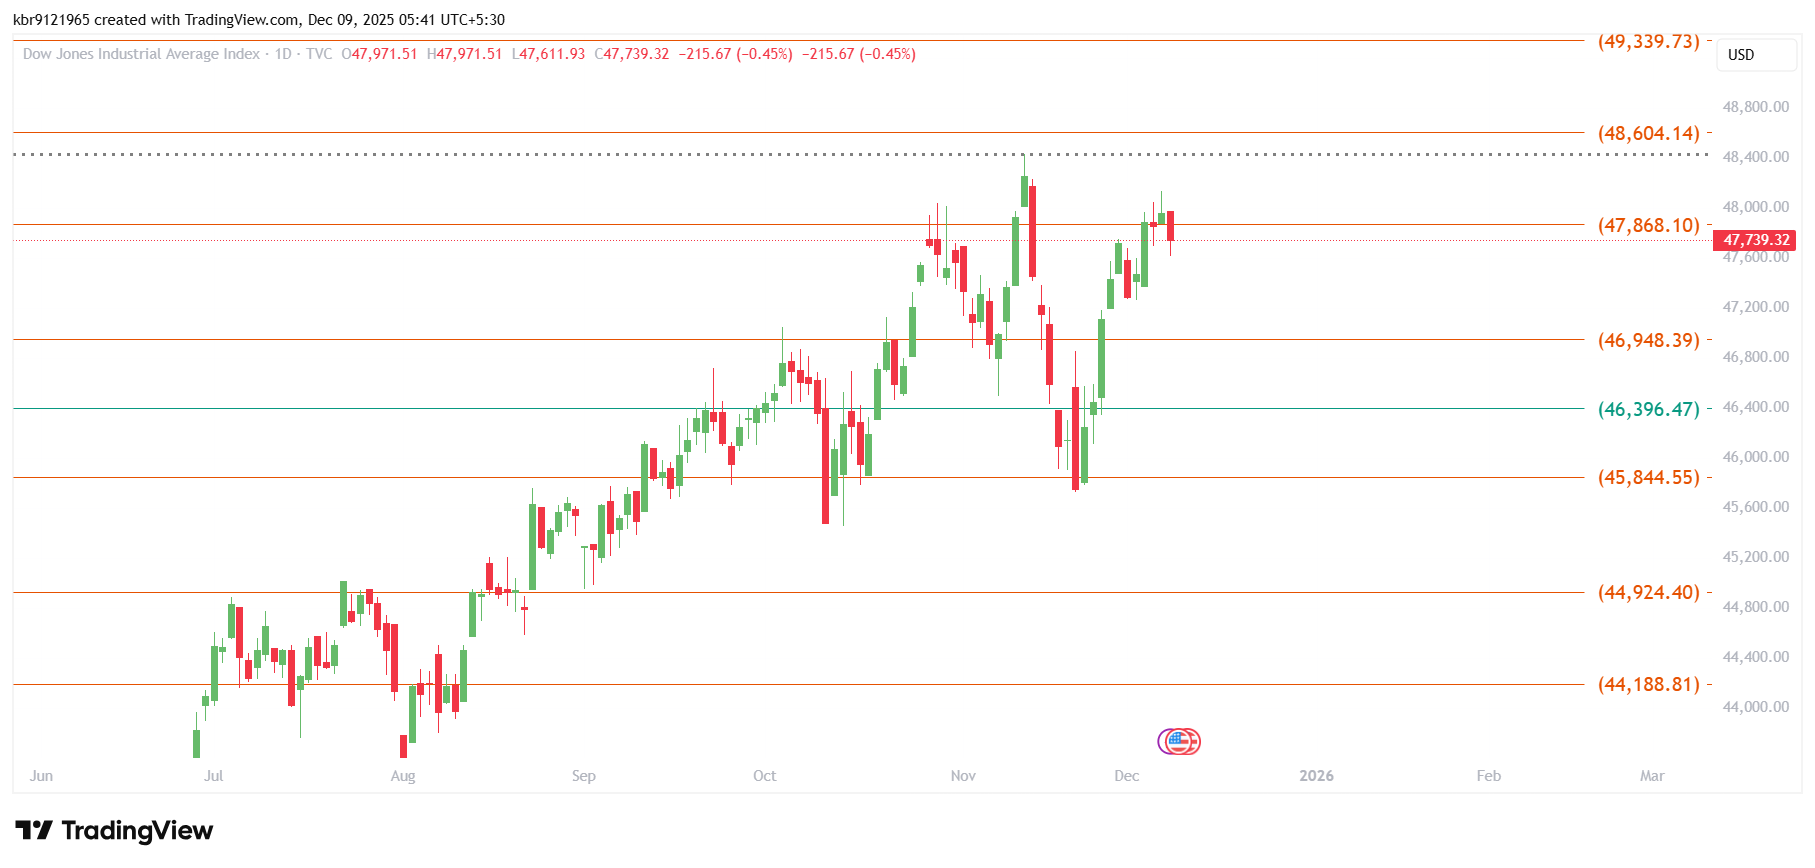
Dow Jones Industrial Average Gann Analysis Chart is given below. The chart depicts two important Gann Swing Levels of 47868.10 and 45844.55. The Gann resistance level of 47868.10 was hit many times yet we have failed to sustain it convincingly. the Gann Swing level of 45844.55 has acted as a strong support. Above these Gann swing levels we have support and resistance at 44924.40 and 48604.14 respectively. Intermediate Gann Trading Levels are 46948.39 and 46396.47. Use the Gann Levels given here to trade confidently. Make some decent profits on these levels. Keep visiting here on this blog and ask your queries I will be happy to answer them. If you intend to learn my way of Gann Analysis in Markets do join anyone of our courses as per your choice and trade confidently.
Happy Trading !!!