The Law of Vibration Gann forms the cornerstone of true Gann analysis, a timeless approach pioneered by the legendary trader W.D. Gann. This universal principle asserts that every market, stock, commodity, or index—like the Nifty 50—vibrates according to its own unique frequency, governed by natural laws of mathematics, time, price harmony, and cycles. Gann discovered that nothing escapes this law; markets move in predictable vibrational patterns driven by internal energies and external influences, allowing precise forecasting of highs, lows, reversals, and trend shifts when properly decoded.
In modern trading, this Law of Vibration Gann has inspired advanced tools that bring his esoteric insights into practical, visual form on platforms like Trading View. One standout example is the Gann Supremacy Ver 369(1) indicator, a sophisticated custom tool built directly on Gann’s foundational Law of Vibration. This indicator maps out market phases—Accumulation, Expansion, Momentum, Contraction, Distribution, and more—while highlighting critical structures such as Double Bottoms, Double Tops, Triple Tops, and key zones like the Birth Zone, Mid-Cycle, Death Zone, and End Cycle.
These elements are not arbitrary; they stem from vibrational alignments where price and time resonate at harmonic levels, revealing the market’s “vibe” and probable future path.
Why the Law of Vibration Gann Matters in Nifty 50 Analysis
The Nifty 50 Index, as a benchmark for the Indian equity market, exhibits clear vibrational behavior. Traditional technical analysis often captures surface trends, but Gann analysis goes deeper by treating the index as a living entity with its own rate of vibration. Identifying this allows traders to anticipate major turning points far beyond simple support/resistance or moving averages.
Key importance includes:
- Cycle Recognition — Markets progress through birth (accumulation), growth (expansion/momentum), maturity (contraction/distribution), and decline (death/end cycle) phases, all dictated by vibration.
- Time-Price Harmony — Reversals frequently align when time cycles (e.g., from major highs/lows) match price levels derived from Gann’s mathematical frameworks.
- Pattern Reliability — Classic formations like double bottoms signal vibrational lows (potential birth/accumulation), while triple tops indicate exhaustion at peak vibration (distribution/death zone).
- Predictive Edge — By decoding the index’s vibration, traders spot when momentum fades or new impulses begin, reducing false signals in volatile sessions.
Real-World Application: Nifty 50 Chart Breakdown with Gann Supremacy Ver 369(1)
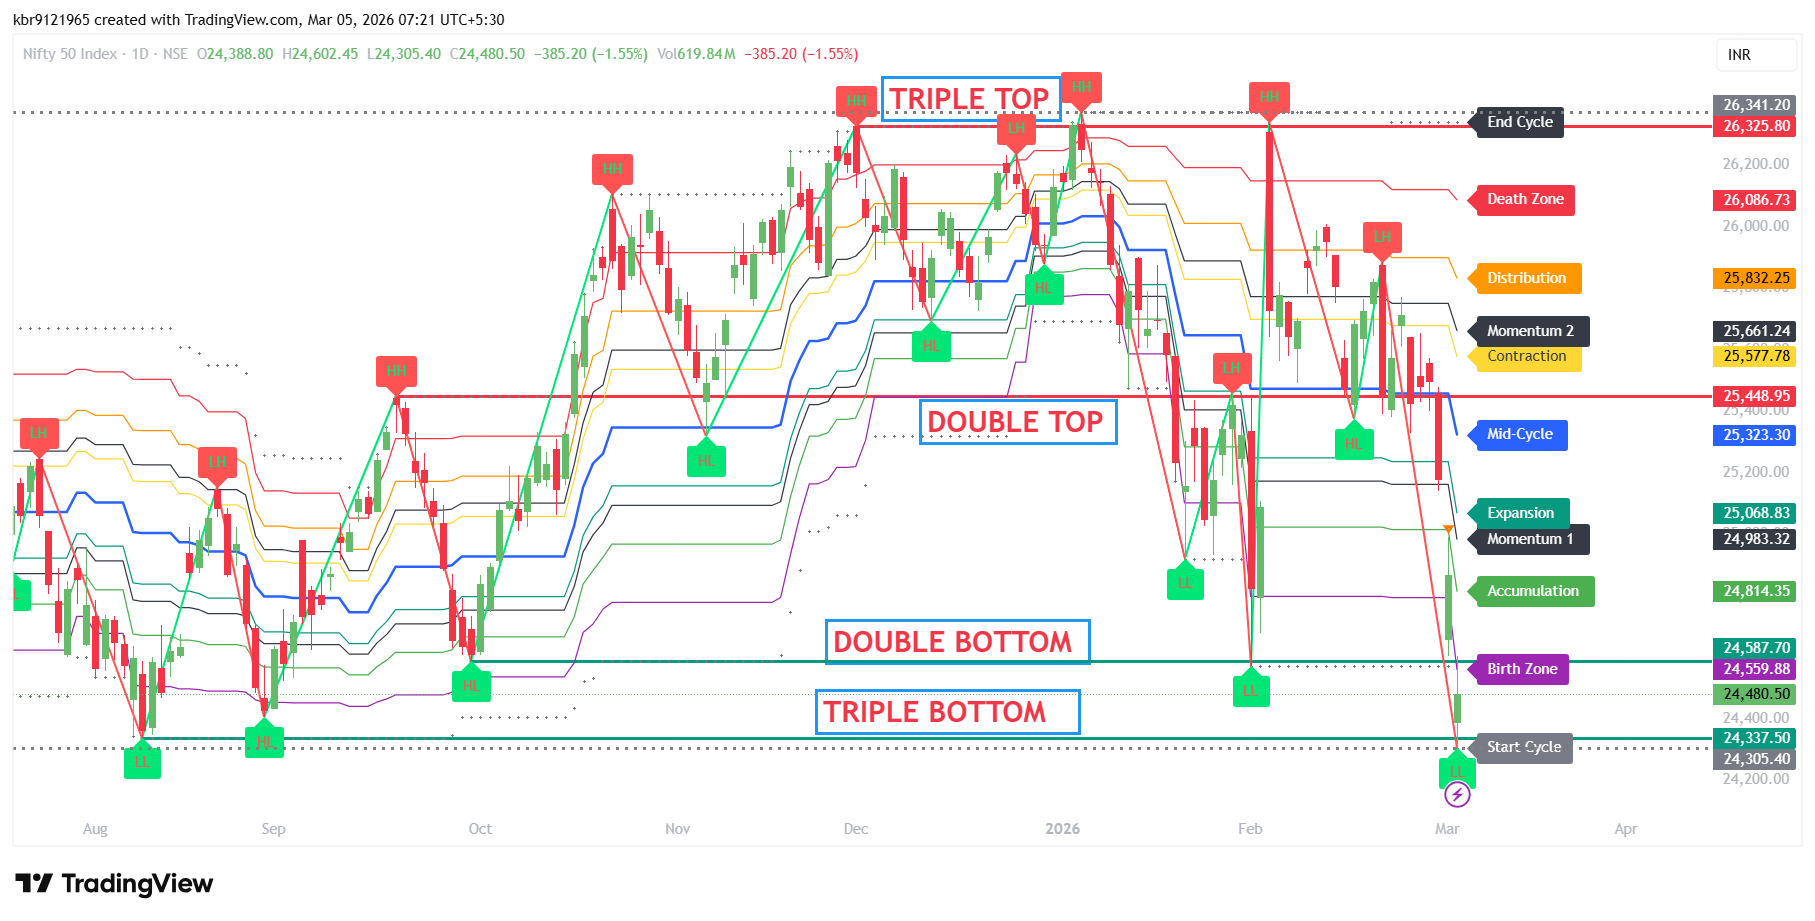
Consider the daily Nifty 50 chart (as analyzed around early March 2026, with the index trading near 24,480 after a -385 point drop, or -1.55%):
The Gann Supremacy Ver 369(1) indicator overlays a clear vibrational roadmap:
- Birth Zone and lower Double Bottom structures near 24,400–24,587 form the cycle start around 24,337–24,305, marking accumulation after a vibrational low.
- Upward momentum builds through Expansion and Momentum 1 phases, pushing toward 25,068–25,661.
- A Double Top appears around the mid-cycle level (~25,448–25,323), signaling distribution and contraction.
- Higher peaks form a prominent Triple Top near 26,000–26,341, with the End Cycle projected at 26,325–26,325.80 in the Death Zone (around 26,086–26,200).
- Recent price action shows rejection from upper zones, with the index dropping into contraction/distribution, aligning with the indicator’s warning of a potential downturn.
This chart vividly demonstrates how the Law of Vibration Gann manifests: the index doesn’t move randomly but follows phased vibrations, with clear transitions between bullish accumulation/expansion and bearish distribution/death phases. The Gann Supremacy Ver 369(1) highlights these shifts visually, making Gann’s complex principles accessible for spotting reversals—like the current breakdown from the triple top—or preparing for future vibrational turns.
Final Thoughts: Elevate Your Trading with Vibrational Insight
In a world of noisy indicators and short-term noise, the Law of Vibration Gann offers a profound edge by revealing the market’s underlying rhythm. Tools like Gann Supremacy Ver 369(1) bridge Gann’s genius to today’s charts, empowering Nifty 50 traders to trade in harmony with natural cycles rather than against them.
Whether you’re navigating accumulation at lows or distribution at highs, understanding vibration transforms guesswork into precision. Study the patterns, respect the zones, and let the market’s own frequency guide your decisions—true Gann supremacy awaits those who master the Law of Vibration Gann.