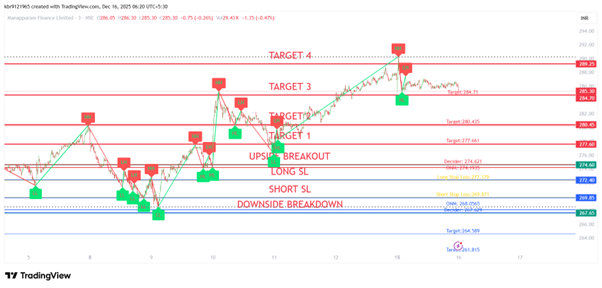
Manappuram Finance has closed on the Gann Swing Chart at 286.25. The breakouts on either side for Gann Swing Chart are 274.62 and 267.62. The upside targets for the Gann Swing Chart are 277.66/280.43/284.71 and 289.23. The downside targets for the Gann Swing Chart are 264.59/261.81/257.54 and 253.25.
Manappuram Finance has achieved all targets and given the fourth target at 289.23. The level to watch on downside is 284.71. Below this level we may see correction. Gann Traders can use the Gann Swing Levels for their trading and make some decent profits. If interested to learn Gann Swing Analysis please join our Gann Price Cycle Course.