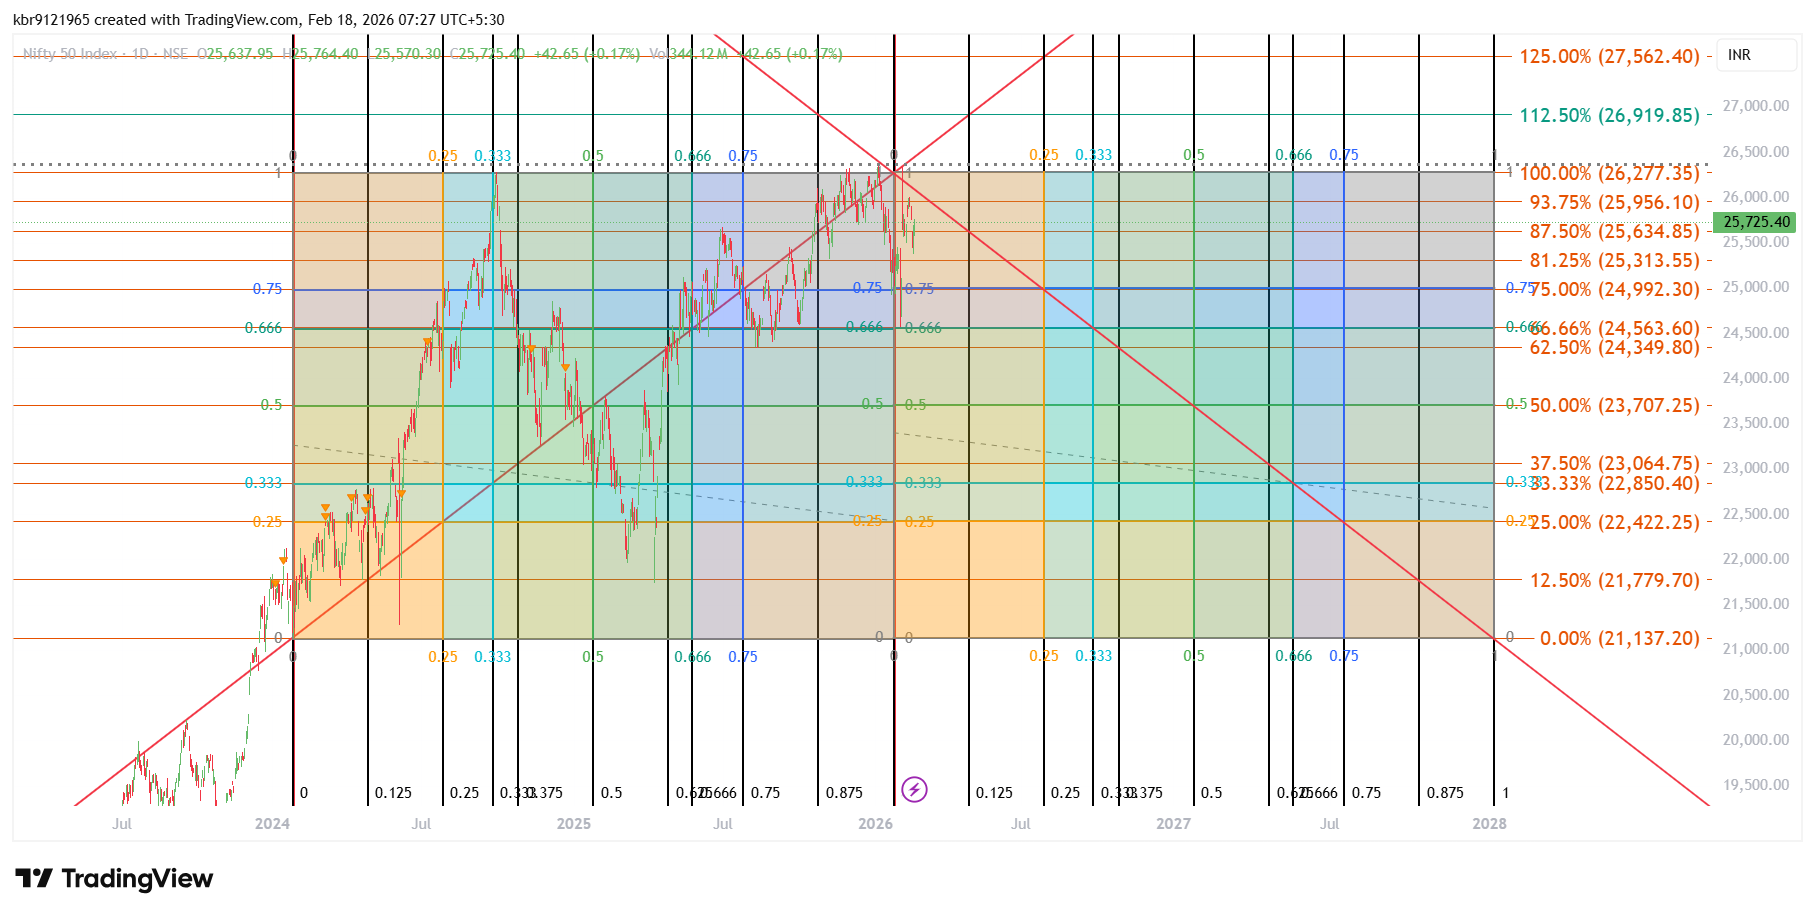
The Nifty 50 closed at 25,725.40 on February 17, 2026, marking a modest gain of +42.65 points (+0.17%) in a session that saw the index trade between a low of around 25,570 and a high near 25,764. Volume stood at roughly 344 million shares, reflecting steady participation amid ongoing consolidation in the broader market.
Nifty Gann Square from the lows of Jan 2024
- Diagonal Red Trend Line: Gann 1×1 Angle
- Gann Price Cycle Levels (from the major low to a presumed high, possibly the all-time high near 26,373 in early January 2026):
- 100% = ~26,277 (27 Sept 2024 High)
- 112.50% = ~26,920
- 125% = ~27,562
- 133.33% ≈ 27,790–28,000 zone
- 93.75% ≈ 25,956
- 87.50% ≈ 25,634 (close to current price action)
- 75% ≈ 24,992
- 66.66% ≈ 24,564
- 50% ≈ 23,707
- And deeper ones down to 0% (~21,137)
The current price (~25,725) sits just above the 87.50% level and below the psychological 26,000 round number / 100% level. This positions Nifty in a strong bullish territory — well above the 50% midpoint (~23,707) and comfortably holding the upper half of the measured move from the 2024 base.
- Gann Time-Based Projections: The chart spans from 2024 through 2028, with denser zones in 2025–2026 indicating higher-probability turning windows.
The price has respected several of these time-price confluences historically (note the candles reacting near intersections), adding credibility to watching upcoming zones in mid-to-late 2026.
Current Market Context and Interpretation
After hitting a peak near 26,373 in early January 2026, Nifty corrected modestly before stabilizing. The recent recovery (from mid-February lows around 25,370–25,400) formed a bullish engulfing pattern on daily candles, pushing back above 25,650–25,700 — a level that previously acted as max pain for options traders.
At 25,725, the index is:
- Testing resistance near 25,956–26,000 (93.75% to 100%)
- Holding strong support at 25,634 (87.50%) and 25,500–25,570 zones
- In a broader uptrend channel since 2024, with the diagonal projection hinting at continued upside potential toward 26,900–27,500+ if momentum sustains
Short-term risks include profit booking near psychological barriers or external cues (global rates, FII flows, earnings season). A break below 25,500 could test 25,000–24,900 (75–81% area), but the structure remains bullish unless we see a decisive close below the 66–75% zone (~24,500–25,000).
Outlook for Traders and Investors
This chart presents an optimistic long-term view: the rally from 2024 lows remains intact, with Fibonacci extensions pointing to 27,000+ as realistic medium-term targets (potentially into 2027–2028 based on time projections).
Bullish scenario — Hold above 25,600–25,700 → push toward 26,000–26,300, then extension to 27,000+ on a breakout.
Cautious/neutral scenario — Range-bound between 25,500–26,000 until a fresh catalyst emerges.
Bearish scenario (low probability currently) — Breakdown below 25,300–25,500 → deeper pullback to 24,500–23,700.
For positional traders, dips toward 25,500–25,600 offer attractive risk-reward entries with stops below recent swing lows. Momentum players can watch for a decisive close above 26,000 to confirm the next leg higher.
The Indian market continues showing resilience, trading near lifetime highs with controlled volatility. Tools like this Fibonacci time-price overlay remind us that markets often respect mathematical harmony — both in price levels and timing.
What are your thoughts on Nifty’s next move? Are you positioned for the next upside leg, or waiting for a deeper retracement? Share in the comments! 📈🇮🇳
Disclaimer: This is educational analysis based on the provided chart snapshot and public market data as of February 18, 2026. Not investment advice — always do your own research and manage risk appropriately.