The Nifty 50 closed at 25,725.40 on February 17, 2026, marking a modest gain of +42.65 points (+0.17%) amid steady trading volume of around 344 million shares. The index traded in a range between 25,570.30 (low) and 25,764.40 (high), reflecting cautious optimism in the Indian equity market as it consolidates near recent levels.
This snapshot from Trading View highlights a daily chart overlaid with Fibonacci retracement levels, offering valuable insights into potential support, resistance, and trend direction. We learn this on short term basis in our Gann Intraday Trading Course, and on long term basis in our Gann Price Cycle Course and Gann Time Cycle Course.
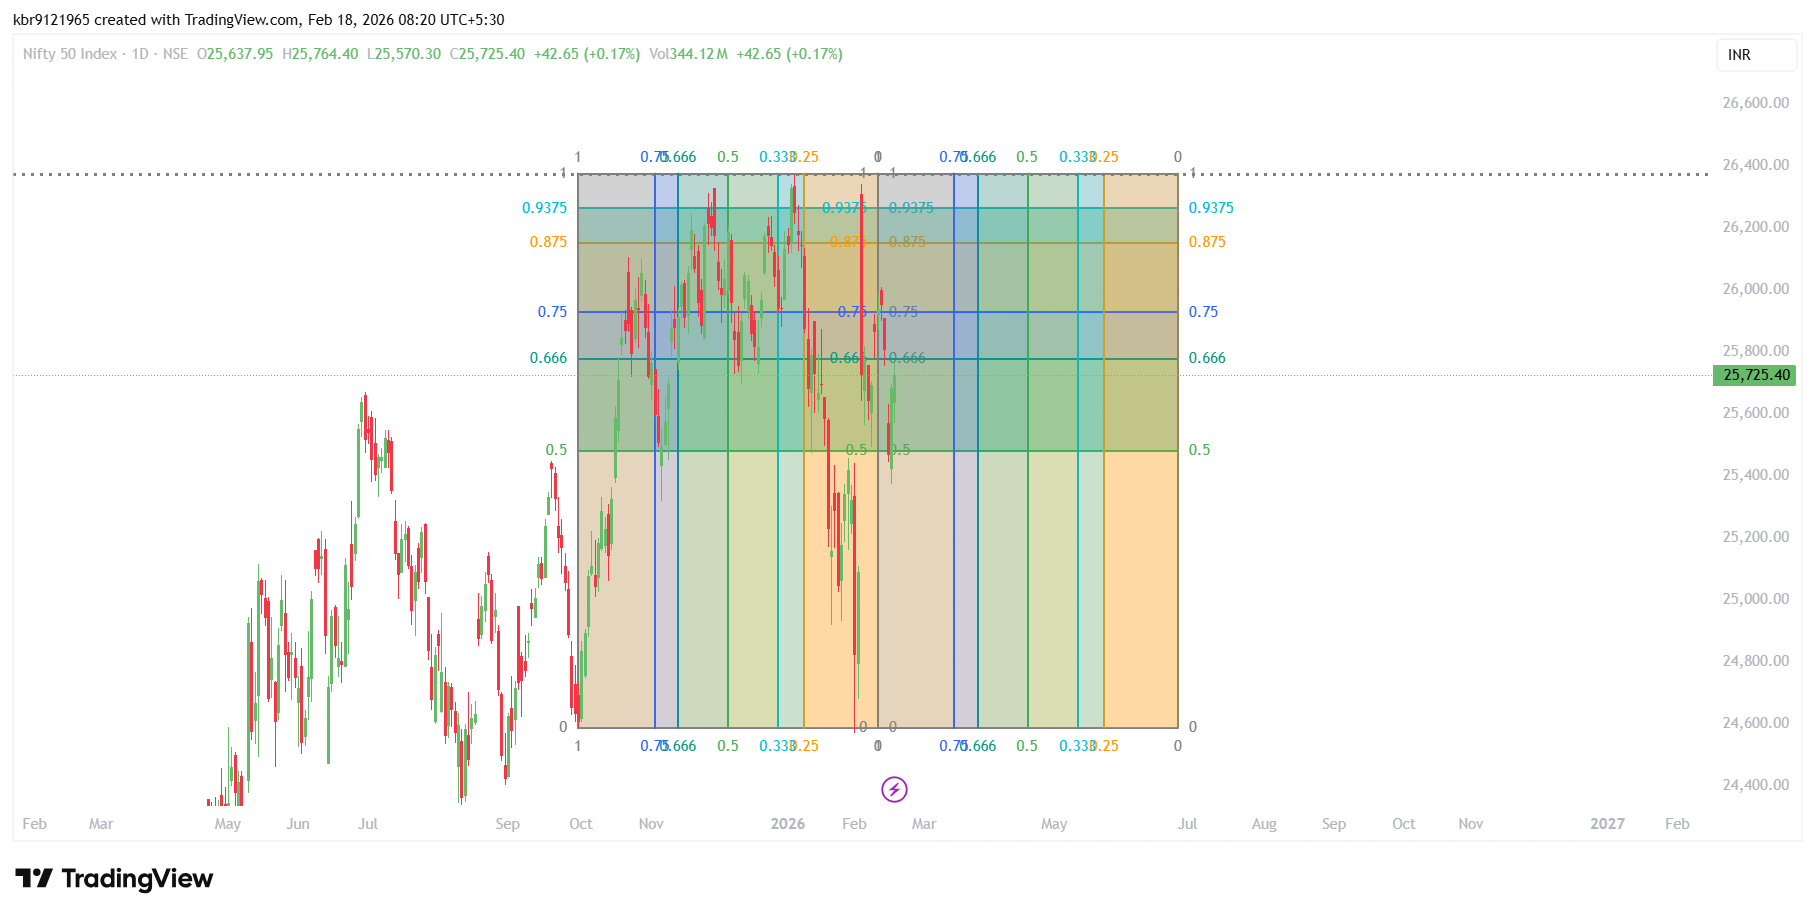
Understanding the Fibonacci Setup on the Chart
The chart applies Fibonacci retracement from a major low (around the early 2025 base near ~24,400–24,800) to a significant high (peaking near 26,373–26,600 earlier in 2026 or late 2025). Key horizontal levels include:
- 0.9375 and 0.875 — Upper retracement zones near 26,200–26,400, acting as strong resistance.
- 0.75 — A prominent level around 26,000, often a psychological and technical barrier.
- 0.666 — Near 25,800, with recent price action testing this area.
- 0.5 — The classic 50% retracement around 25,400–25,500, providing mid-range support.
- 0.333 and lower — Deeper pullback zones toward 25,000 or below.
The current close at 25,725 sits comfortably between the 0.666 and 0.5 levels, in a zone colored in lighter shades on the chart, suggesting a balanced consolidation phase after a pullback from higher levels.
The price has formed a series of green and red candles over the past several months, with a visible upward trend from mid-2025 lows, followed by a corrective phase in late 2025–early 2026. Recent sessions show recovery, with the index reclaiming key short-term moving averages.
Current Market Context and Technical Outlook
- Bullish Signals: The index closed positively for the second straight session, holding above the 100-day moving average near 25,700. Sectoral strength in PSU banks, IT, and FMCG supported the upmove, while a lower India VIX (around 12.67) indicates reduced fear in the market.
- Resistance Ahead: Immediate hurdles lie at 25,750–25,800 (near the 50-DMA and 0.666 Fib). A decisive breakout above 25,800 could open the door to 26,000 and potentially 26,350 in the coming weeks.
- Support Levels: Key floors are at 25,600–25,640, followed by 25,500–25,580. A slip below these could test deeper Fib zones like 25,300 or the 0.5 level.
- Range Outlook: Analysts suggest the Nifty may trade in a 25,500–26,000 band in the near term, with balanced buying and selling pressure.
Broader 2026 Perspective
The Nifty 50 has shown resilience in early 2026, recovering from dips while the broader market digests gains from 2025 (where it crossed significant milestones). Long-term forecasts remain constructive, with some projections eyeing 28,000–29,000 by year-end 2026, driven by expected earnings growth (12–15%) and potential FII inflows. However, 2026 could bring increased volatility (“The Year of the Whip” in some cycle analyses), with whipsaw moves around key Fib and cycle turning points.
Trading Takeaways
For positional traders: Buy on dips near 25,600 support remains a favored strategy, with upside targets at 26,000+ if momentum sustains. Short-term traders should watch for a breakout above 25,750 or breakdown below 25,580 for directional cues.
The market is at a pivotal consolidation phase — respecting Fibonacci levels while building strength for the next leg. Stay disciplined, monitor volume and global cues, and let price action guide the next move.
What are your views on Nifty’s current Fib setup? Planning any trades around these levels? Share in the comments! 🚀