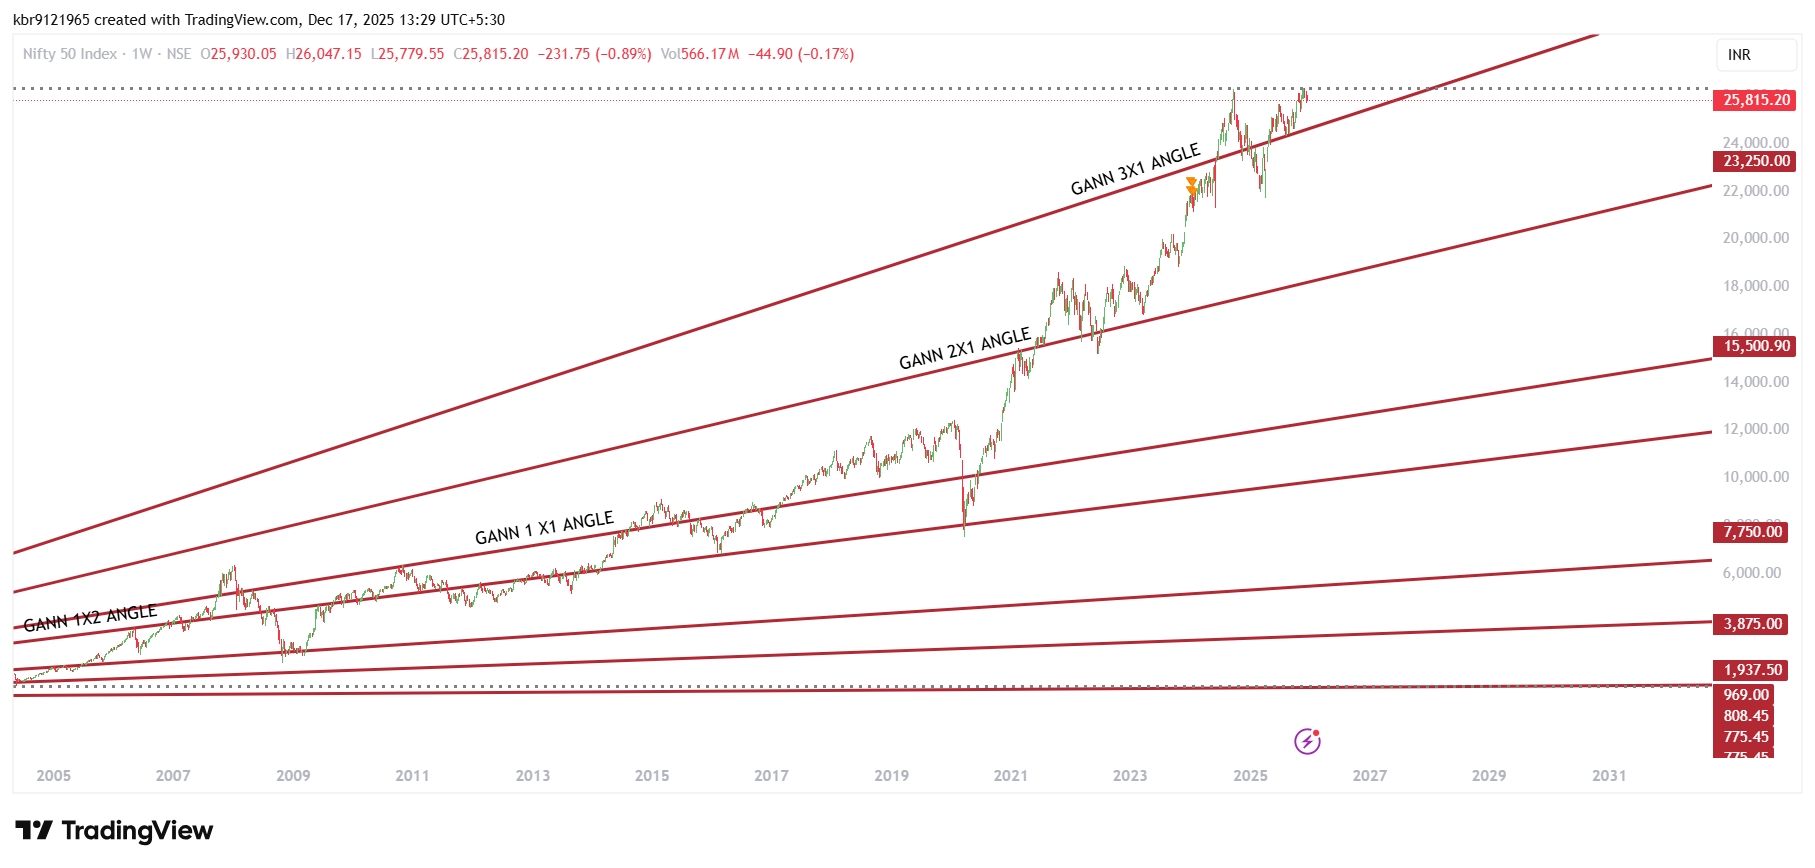
Nifty Weekly Chart above shows the True Gann Angles. Gann Angles have the ability to forecast the trend. Just one look at the Gann Angles Chart tells you what W. D. Gann called the *”Position of the Markets”*. On the Gann Angles Chart we see the Covid Fall resting itself on the Gann 1×2 Angle…. popularly known as the *” 50% Angle”*. Currently the Nifty index is well poised above the Gann 3×1 Angle. The recent low or support taken on the Gann Angle shows it significance. Gann Angles Lines are Price Time Squaring points when hit by price action we see trend reversals most of the times. Gann students can study the chart and enhance their Knowledge by learning how to draw True Gann angles without any software.