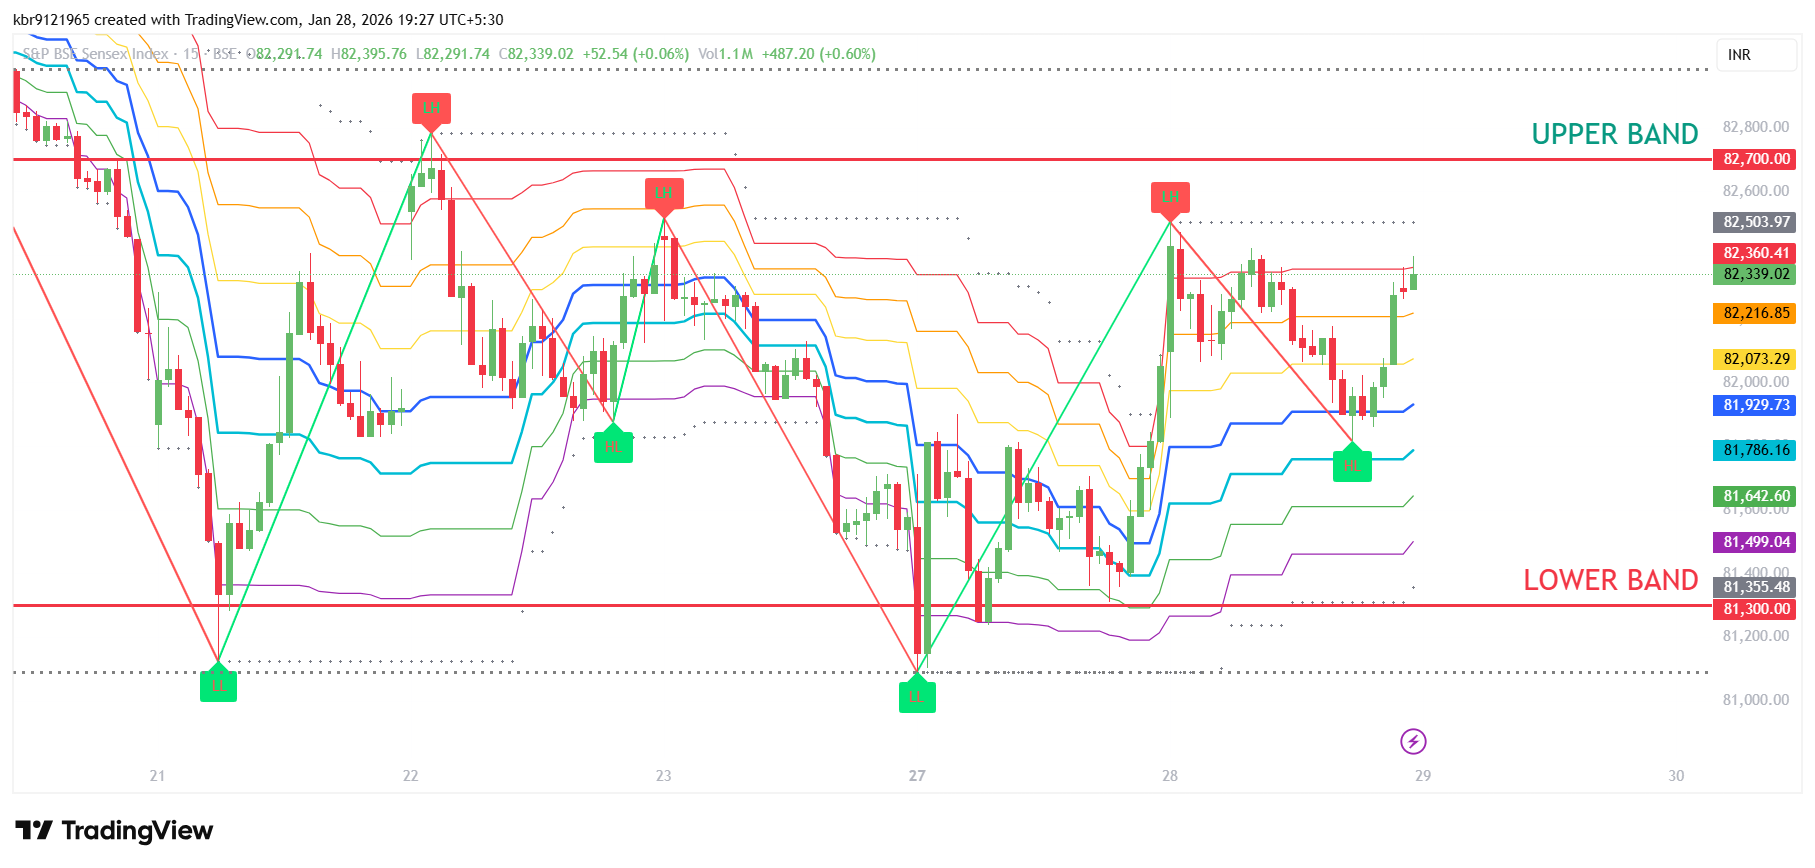
Sensex has been sideways as per bands marked on charts. The moves may seem wild for the traders but they were measured. The lows formed are double bottom around important Gann levels . We need to see the upper Gann Level where we have formed a double top just before reaching it. The chart shows our dynamic indicator Gann Supremacy with dynamic Gann Levels formed in Live Markets. The same Gann levels are helpful while trading on different timeframes as per the trader/investor’s choice.
15 min swing chart with important Gann Levels formed at the close of 28 Jan 2026 is seen above. The levels will change with Live Markets at open, yet we can see important levels to trade for tomorrow. We need to stay above 82360 for further momentum. 82216 if broken can lead to supports of 81930. This level is trend decider for tomorrow below which trend is down. Supports on the downside are 81786/ 81642/ 81460.
Traders can use this level for their trading bias. Intraday players will need to see dynamic levels formed as per the dynamic range seen live. To use this paid indicator contact the author on Trading View. The rates for the indicator will change from 31 Jan 2026. If interested avail the prevailing rates by subscribing now.