W.D. Gann (1878–1955) remains one of the most enigmatic and influential figures in technical analysis. A legendary trader who claimed extraordinary success in stocks and commodities, Gann developed a comprehensive system based on geometry, time cycles, astrology, and mathematics. At the core of his philosophy lies the Law of Vibration — a principle he considered the foundation of all market movements.
Gann believed that everything in the universe vibrates, and financial markets are no exception. Each stock, commodity, or index possesses its own unique “vibration rate” or energetic signature — a mathematical harmony that governs price swings, trend changes, and turning points. By decoding this vibration, traders can forecast future highs, lows, and reversals with greater precision.
In modern trading communities, particularly in India, analysts frequently apply Gann’s principles to the Nifty 50 Index (NSE:NIFTY), India’s benchmark equity index representing the top 50 companies on the National Stock Exchange.
What is Gann’s Law of Vibration?
Gann described the Law of Vibration as a universal law ruling market cycles. Key ideas include:
- Markets move in predictable cycles because collective human behavior creates repeating patterns.
- Each market has a specific “vibration” — derived from historical highs/lows, price ranges, and time intervals — that determines support/resistance and reversal zones.
- Price and time are interconnected: when price and time “square” (e.g., a move of X points over X days/weeks), major turns often occur.
- Vibrations manifest through mathematical tools like the Square of 9, Gann angles (e.g., 45° for 1:1 price-time balance), and time cycles (90 days, 180 days, anniversaries of major pivots).
Gann viewed the market as a “grand cosmic instrument” where natural laws — similar to planetary orbits or musical harmonics — dictate order amid apparent chaos.
Applying the Law of Vibration to Nifty 50
The application of Gann’s Law of Vibration requires in depth understanding of the concept as applied to stock market vibrations on a particular scrip or index. We learn this in our Gann Price Cycle Course and Gann Time Cycle Course.
Identifying the Unique Vibration of Nifty
Every index has its “vibrational alignment.” For Nifty 50:
- Analysts often start from major historical turning points (e.g., pandemic low ~7,511 in March 2020, or all-time highs).
- They calculate vibration-based levels using Gann’s methods: converting price to time (squaring), using Square of 9 for targets, or finding harmonic zones where vibration “balance shifts.”
- Example: In studies of 2022 declines, vibration alignment highlighted sensitive price zones where reversals became probable once internal conditions (price-time symmetry) shifted.
Examples on Nifty 50 Index:
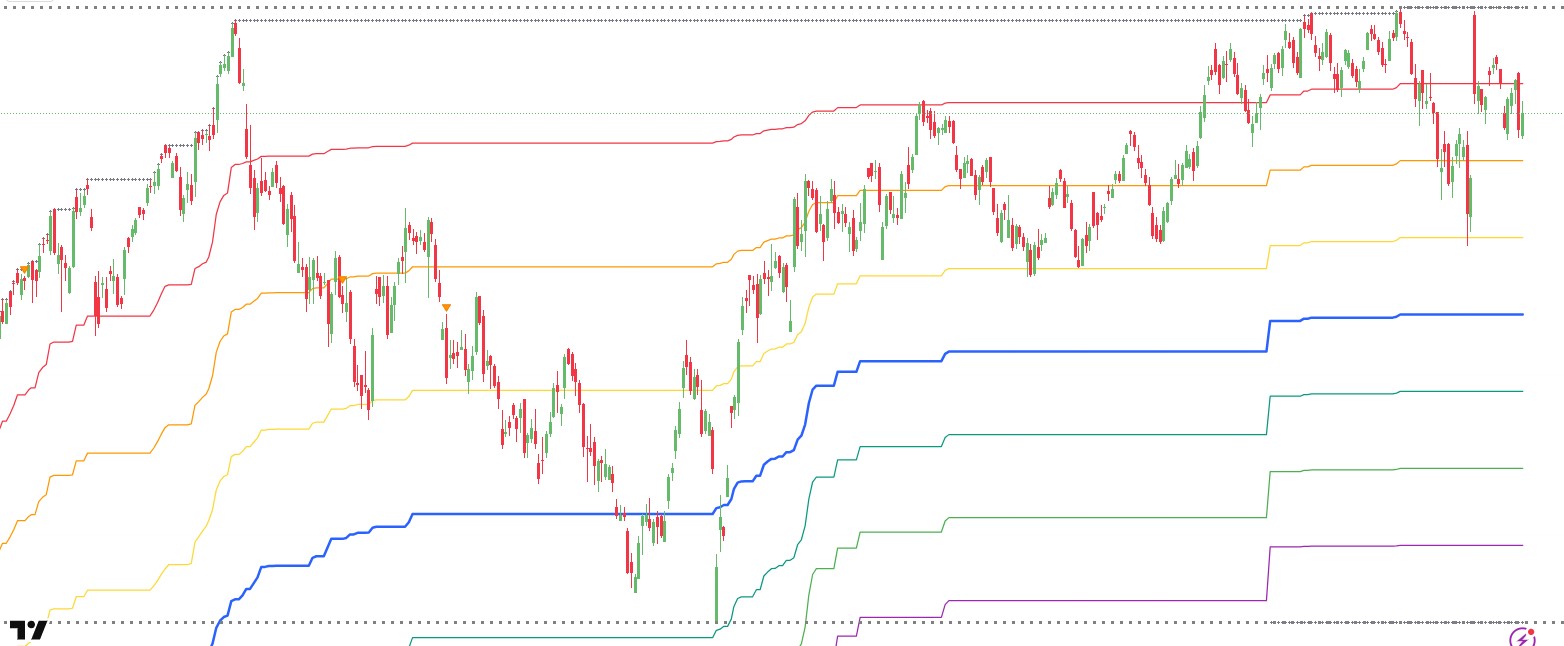
- Nifty 50 Index Chart showing Daily Time Frame Vibrations as per our Gann Supremacy Ver 369 Indicator available on Trading View
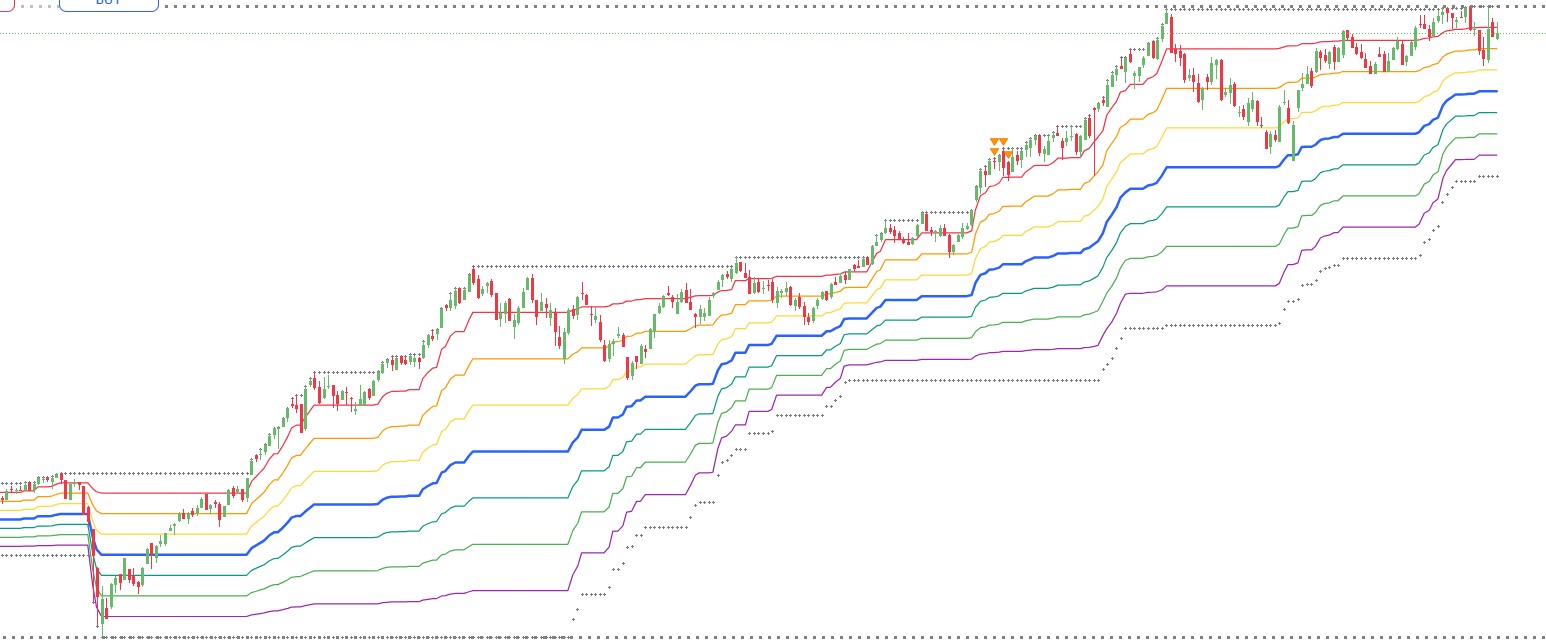
- Nifty 50 Index Chart showing Weekly Time Frame Vibrations as per our Gann Supremacy Ver 369 Indicator available on Trading View
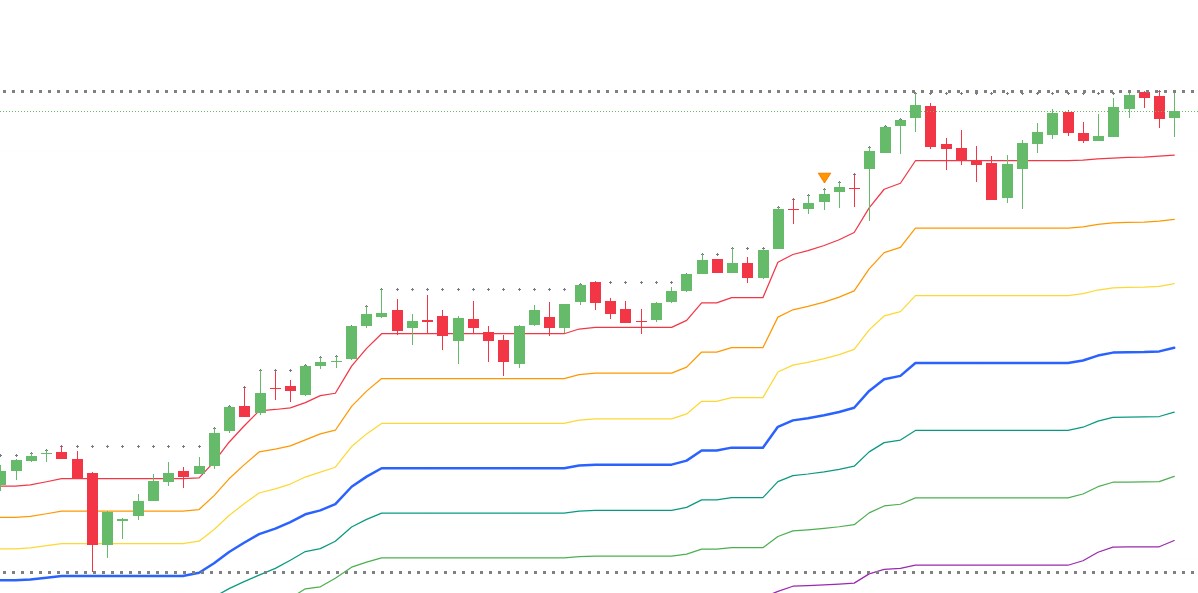
- Nifty 50 Index Chart showing Monthly Time Frame Vibrations as per our Gann Supremacy Ver 369 Indicator available on Trading View
Benefits and Limitations for Nifty Traders
Benefits:
- Provides an edge in timing reversals beyond conventional indicators.
- Combines time and price for confluence
- Works well in trending indices like Nifty during structural shifts.
Limitations:
- Highly subjective — finding the “correct” vibration requires experience.
- Not foolproof; Gann methods demand back-testing and integration with other tools.
- Effectiveness debates persist, though practitioners report consistent results on Nifty.
Final Thoughts
Gann’s Law of Vibration invites traders to view the Nifty 50 not as random chaos, but as a living entity with its own rhythm. By studying historical pivots, time cycles, and mathematical harmony, analysts decode when the index’s “vibration” shifts — often leading to high-probability turns.
Whether you’re a beginner exploring Gann angles or an advanced trader squaring price and time, the Law of Vibration offers a timeless lens for understanding Nifty’s behavior.
Markets vibrate. Master the vibration, and you master the market.
Visit our courses section on here to learn Gann’s Law of Vibration on 1) Intraday 2) Price Cycles and 3) Time Cycles by joining our Gann Intraday Trading Course, Gann Price Cycle Course and Gann Time Cycle Course.